
Drawing and the mouse
The built-in views cover text, controls and layout. When you need something
they don’t have (a chart, a map, a game board, a signature pad), you draw it
yourself in a Canvas, and you follow the mouse over it with .onPointer.
A first drawing
Section titled “A first drawing”A Canvas is a view with a block. The block gets a Graphics value,
usually called g, and draws by calling its methods:
struct Month {    name: String    sales: Float}
app Sales(title: "Sales", width: 420, height: 260) {    state months = [        Month(name: "Jan", sales: 12), Month(name: "Feb", sales: 18), Month(name: "Mar", sales: 9),        Month(name: "Apr", sales: 24), Month(name: "May", sales: 21), Month(name: "Jun", sales: 30),    ]
    Canvas { g in        let top = 20.0        let bottom = g.height - 28.0        let step = g.width / Float(months.count)        let most = months.map { m in m.sales }.max() ?? 1.0        g.line(0, bottom, g.width, bottom, color: .separator)        for (i, month) in months.enumerated() {            let height = (bottom - top) * month.sales / most            let x = Float(i) * step + step * 0.2            g.fillRect(x: x, y: bottom - height, width: step * 0.6, height: height, color: .blue, radius: 4)            g.text("{Int(month.sales)}", x: x + step * 0.3, y: bottom - height - 4, size: 11, color: .secondary, align: .bottom)            g.text(month.name, x: x + step * 0.3, y: bottom + 6, size: 12, align: .top)        }    }    .padding(16)}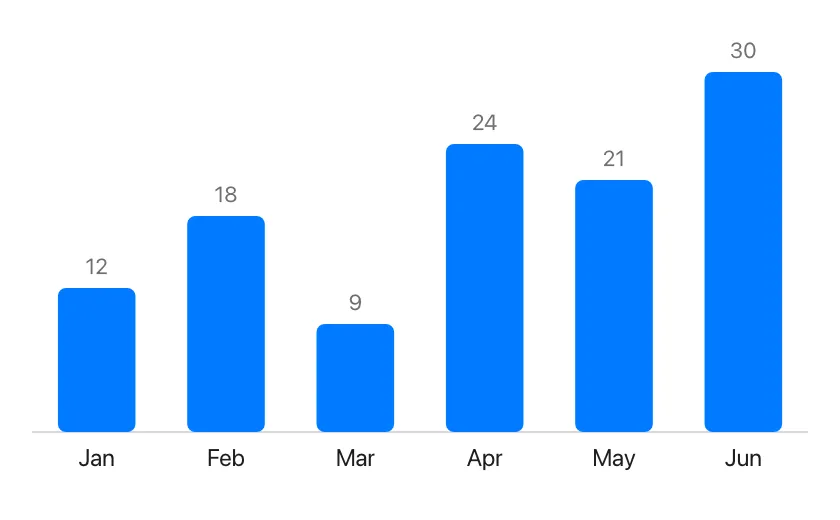
A few things to know:
- Coordinates are in points, from the canvas’s top left corner:
xgrows to the right andygrows downwards.g.widthandg.heightare the canvas’s size. - A canvas takes all the space it’s offered, like a
Scroll. Give it a.frame(width:height:)for a fixed size. - The block describes the whole picture. Like the rest of the UI, it runs again whenever the window is drawn, so it draws what the state says now: there’s nothing to erase or update. Drawing is fast; thousands of shapes are fine.
- The block only draws. Don’t change
statein it: changes belong in actions, like everywhere else. - Nothing shows outside the canvas, however far you draw.
Shapes, paths and transforms
Section titled “Shapes, paths and transforms”There are two ways to draw a shape. The quick one is a method that draws it
at once: g.line, g.fillRect, g.strokeRect, g.fillCircle,
g.strokeCircle. The general one is a path: you describe an outline,
then fill it, stroke it (draw its line), or both.
app Shapes(title: "Shapes", width: 420, height: 200) {    Canvas { g in        // A shape with a hole: two parts in one path, filled "even-odd".        g.beginPath()        g.rect(x: 10, y: 10, width: 100, height: 100, radius: 12)        g.circle(x: 60, y: 60, radius: 25)        g.fill(.orange, evenOdd: true)        g.stroke(.primary, width: 2)
        // A path made point by point, with a dashed outline.        g.beginPath()        g.moveTo(140, 100)        g.lineTo(170, 20)        g.curveTo(200, 0, 230, 120, 260, 30)        g.stroke(.purple, width: 3, dash: [8, 5])
        // The same star three times, moved, turned and scaled.        for i in 0..3 {            g.save()            g.translate(300.0 + Float(i) * 40.0, 60)            g.rotate(Float(i) * 0.4)            g.scale(1.0 + Float(i) * 0.3, 1.0 + Float(i) * 0.3)            g.beginPath()            g.lines([0, -14, 4, -4, 14, -4, 6, 3, 9, 14, 0, 7, -9, 14, -6, 3, -14, -4, -4, -4], closed: true)            g.fill(.green)            g.restore()        }        g.text("fill, stroke, transform", x: g.width / 2, y: g.height - 12, size: 12, color: .secondary, align: .bottom)    }    .padding(12)}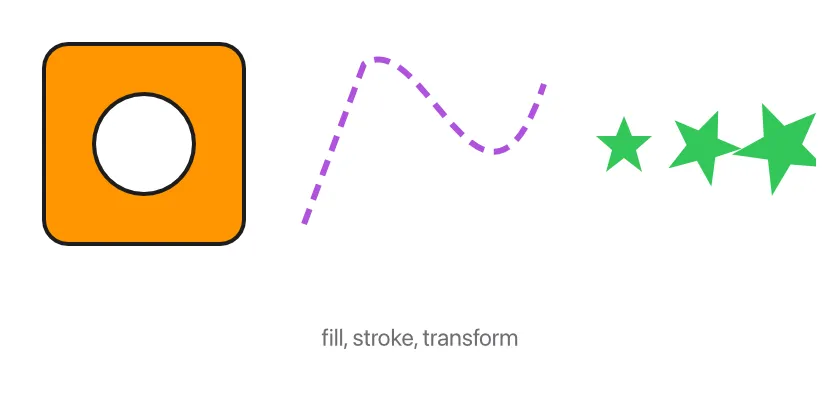
g.beginPath()starts an empty path.moveTostarts a part of it,lineTo,quadToandcurveTocontinue it, andclosePathjoins the part’s end to its start.rect,circle,ellipseandarcadd whole shapes, andlinesadds a line through many points at once.g.fill(color)andg.stroke(color, width:)draw the path and keep it, so one path can be filled and then outlined. The nextbeginPathstarts afresh.- A path with several parts fills everything inside any of them. With
evenOdd: true, a part inside another makes a hole. g.translate,g.scaleandg.rotatechange where the coordinates that follow land: afterg.translate(100, 50), the point (0, 0) is drawn at (100, 50).g.save()remembers the transform andg.restore()goes back to it, so a piece of drawing can move things without disturbing the rest.- Line widths and text sizes are always in points, whatever the scale:
a
width: 2line is 2 points wide even afterg.scale(1000, 1000). That suits charts and maps, where the data is scaled but the pen shouldn’t be. To enlarge a drawing as a whole, pen and letters included, useg.zoom(2)instead ofg.scale(2, 2).
Many points at once
Section titled “Many points at once”g.lines(points, closed:) takes a list of numbers, x, y, x, y, …, and adds
a line through all of them (a closed outline, with closed: true). It’s the
fast way to draw data: a plot of 100 000 measurements, a coastline, a
polygon from a file.
Put the transform to work here. Keep the points in the units of your data, and let the transform place them:
// `track` holds x, y pairs in meters; show 1 meter as 2 points, with y upwards.g.save()g.translate(g.width / 2, g.height / 2)g.scale(2, -2)g.beginPath()g.lines(track)g.stroke(.red, width: 1.5)g.restore()The arithmetic is done in full precision before anything is drawn, so coordinates in the millions (a map in meters) stay exact on screen, and parts of the line outside the canvas cost nothing.
Text and pictures
Section titled “Text and pictures”g.text draws text at a point. align: says which part of the text sits at
that point: .topLeading (the default) puts the text’s top left corner
there, .center its middle, .bottom the middle of its lower edge.
g.text("Sales by month", x: 12, y: 8, size: 16, weight: .bold)g.text("Mar", x: 150, y: 200, size: 12, color: .secondary, align: .top)g.text("Mount Apo", x: 80, y: 60, size: 12, align: .center, halo: .white, haloWidth: 1.5)A halo is an outline in another color under the text. It keeps a label
readable on top of a busy drawing. angle: turns the text around its point
(in radians). g.textWidth(text, size:, weight:) tells how wide a text will
be, for placing things next to it.
italic: and family: choose the font, as
.font does for views: any family installed
(see fontFamilies), or "monospaced".
Pass the same ones to g.textWidth.
g.text("Total", x: 10, y: 10, size: 13, weight: .bold, italic: true, family: "Georgia")let w = g.textWidth("Total", size: 13, weight: .bold, italic: true, family: "Georgia")g.text("=SUM(B2:B9)", x: 20 + w, y: 10, size: 13, family: "monospaced")g.image(path, x:, y:, width:, height:) draws a PNG or JPEG file into a
rectangle, and opacity: makes it see-through. It returns false if the
file isn’t there (or isn’t a picture), so you can draw something else
instead. Pictures follow the transform like everything else: after
g.rotate(…) a picture is drawn turned.
g.svg(path, x:, y:, width:, height:) draws an SVG file the same way,
scaled to fit the rectangle and centered in it. g.svg(text: …) draws SVG
source from the program instead. color: is the color of currentColor in
the SVG, as with the Svg view.
Pictures from pixels
Section titled “Pictures from pixels”A picture you compute (a heat map, a fractal, a frame of a simulation)
doesn’t need a file. g.image(pixels:pixelWidth:pixelHeight:…) draws a list
of pixels, row by row from the top left, each one a number like
writeImage takes: red × 16777216 + green
× 65536 + blue × 256 + opacity, each from 0 to 255.
// A 256 × 256 picture: red grows to the right, green downwards.fn gradientPixels() -> [Int] {    var pixels: [Int] = []    for y in 0..256 {        for x in 0..256 {            pixels.append(x * 16777216 + y * 65536 + 128 * 256 + 255)        }    }    pixels}
app Pixels(title: "Pixels", width: 300, height: 300) {    state pixels = gradientPixels()
    Canvas { g in        g.image(pixels: pixels, pixelWidth: 256, pixelHeight: 256, x: 0, y: 0, width: g.width, height: g.height)    }}
The picture is kept between frames: drawing the same pixels again costs
only a quick look through them to see they haven’t changed (about 1.5 ms for
a 2048 × 2048 picture). When they do change, the new picture is made at
once. Pictures can be up to 8192 pixels wide and tall; it returns false
(and draws nothing) when the size is wrong or the list is too short.
Gradients
Section titled “Gradients”g.fillLinear and g.fillRadial fill the current path with colors that
change across it, and g.strokeLinear and g.strokeRadial draw its line
that way:
- Linear: the colors change along the line from (
x1,y1) to (x2,y2). Before its start the first color shows, after its end the last. - Radial: the colors change from the point (
x,y) out toradiusfrom it, in rings.
colors: is two or more colors, spread evenly. To place them yourself, give
stops: with a place for each color, from 0 (the start) to 1 (the end):
colors: [.red, .yellow, .green], stops: [0, 0.2, 1] keeps the red-yellow
part short. The points are in the current coordinates, so a gradient turns
and scales with the transform, like the path it fills.
Layers and blending
Section titled “Layers and blending”g.beginLayer() starts a layer: what’s drawn until g.endLayer() is drawn
on its own first, then put onto the drawing under it as a whole.
opacity:makes the whole layer see-through at once. Two shapes that overlap in a layer at half opacity don’t show through each other, as two half see-through shapes would.blend:says how the layer’s colors mix with the colors under it, as in a photo editor:.multiplydarkens (white changes nothing),.screenlightens (black changes nothing),.difference,.color,.luminosityand the rest of BlendMode.
Layers nest, and a clip begun in a layer ends with it. g.restore() also
ends the layers begun since the matching g.save().
app Effects(title: "Effects", width: 420, height: 240) {    Canvas { g in        // A sky: a linear gradient from top to bottom.        g.beginPath()        g.rect(x: 0, y: 0, width: g.width, height: g.height, radius: 12)        g.fillLinear(x1: 0, y1: 0, x2: 0, y2: g.height, colors: [.rgb(40, 60, 160), .rgb(250, 160, 120)])
        // A sun: a radial gradient, fading out at its edge.        g.beginPath()        g.circle(x: 110, y: 110, radius: 70)        g.fillRadial(x: 110, y: 110, radius: 70, colors: [.rgb(255, 250, 200), .rgb(255, 200, 80), .rgba(255, 160, 60, 0)], stops: [0, 0.4, 1])
        // Three circles, each multiplied onto what's under it: where they        // overlap, the colors darken each other.        let circles = [(270.0, 70.0, Color.rgb(255, 120, 120)), (330.0, 70.0, Color.rgb(120, 255, 120)), (300.0, 120.0, Color.rgb(120, 120, 255))]        for (x, y, color) in circles {            g.beginLayer(blend: .multiply)            g.fillCircle(x: x, y: y, radius: 45, color: color)            g.endLayer()        }
        // An outline whose color changes along it.        g.beginPath()        g.rect(x: 20, y: g.height - 26, width: g.width - 40, height: 14, radius: 7)        g.strokeLinear(x1: 20, y1: 0, x2: g.width - 20, y2: 0, colors: [.yellow, .red, .purple], width: 3)    }    .padding(12)}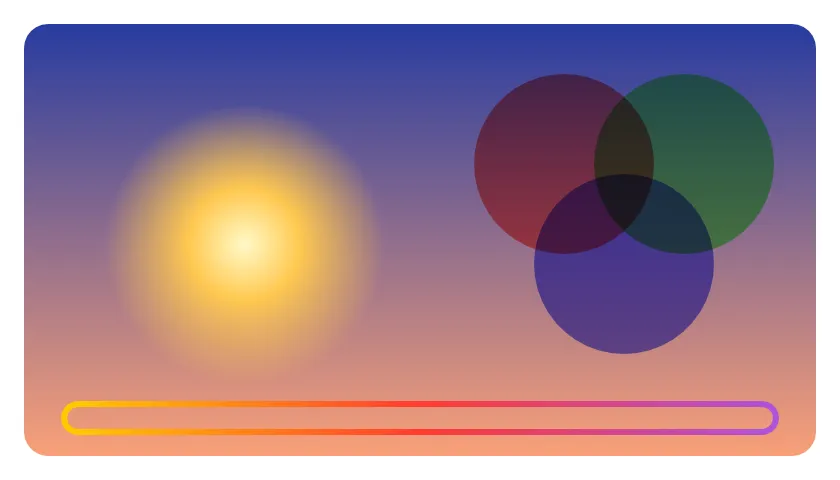
Drawings that take time
Section titled “Drawings that take time”By default the block runs every time the window is drawn. That’s usually
many times a second while something is being dragged, so a drawing of a
million points would make the whole app slow. Give such a canvas a
redraw: number:
Canvas(redraw: version) { g in drawTheWholeMap(g)}Now the drawing is kept. The block runs once, and then again only when
version is different from last time (or the canvas changes size, or the
appearance switches between light and dark). Add 1 to version wherever the
data changes.
Two canvases in a ZStack are a common pair: a kept one for the heavy
picture, and a plain one on top for what follows the mouse.
Following the mouse
Section titled “Following the mouse”.onPointer runs its block with everything the mouse does on a view. This
app draws lines where the mouse is dragged:
app Sketch(title: "Sketch", width: 420, height: 300) {    // Each line drawn is a list of x, y, x, y, …    state lines: [[Float]] = []    state version = 0
    VStack(spacing: 8) {        Canvas(redraw: version) { g in            g.fillRect(x: 0, y: 0, width: g.width, height: g.height, color: .white, radius: 8)            for line in lines {                g.beginPath()                g.lines(line)                g.stroke(.blue, width: 3)            }        }        .cursor(.crosshair)        .onPointer { e in            match e.kind {                .down -> { lines.append([e.x, e.y]) }                .drag -> {                    lines[lines.count - 1].append(e.x)                    lines[lines.count - 1].append(e.y)                }                _ -> {}            }            version += 1        }        HStack {            Text("{lines.count} lines").color(.secondary)            Spacer()            Button("Clear") {                lines = []                version += 1            }        }    }    .padding(12)    .background(.sidebar)    .onKey { key in        if key == "backspace" && !lines.isEmpty {            lines.removeLast()            version += 1        }    }}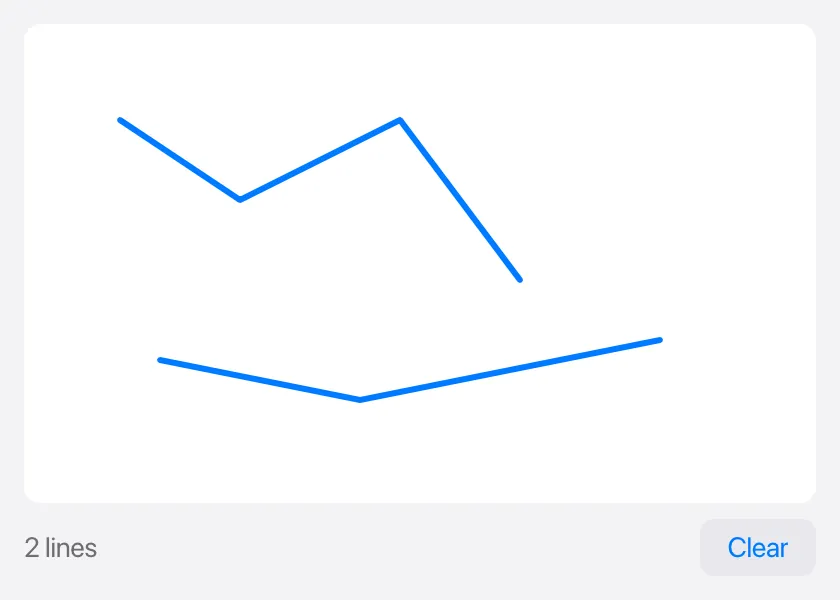
The block gets a PointerEvent. Its
kind says what happened:
kind | When |
|---|---|
.down | A mouse button was pressed on the view. |
.drag | The mouse moved with the button held (also outside the view). |
.up | The button was let go (wherever the mouse is by then). |
.move | The mouse moved over the view with no button held. |
.leave | The mouse left the view. |
.scroll | The wheel was turned, or two fingers moved on a trackpad. |
.pinch | Two fingers were pinched on a trackpad (macOS). |
x and y are where the mouse is, measured like a canvas’s coordinates:
from the view’s top left corner (inside its padding); windowX and
windowY are the same point from the window’s top left corner. dx and dy are how
far it moved since the last event, or how far to scroll. button is
.left, .right or .middle; clicks is 2 for a double click; and
shift, alt and command tell which keys were held.
.onPointer works on any view, not only a canvas. A view that has it gets
all of the mouse: its .onTap and .onDrag don’t run. Buttons and other
controls drawn on top of it still get their own clicks.
.cursor(…) changes the pointer shown over a view: .crosshair for
drawing, .grab for something that can be moved, .hand for a link. The
full list is in CursorStyle.
.onKey runs its block with each key pressed while no text field is being
edited: a character as typed ("a", "A", "+", " "), or the name of a
key: "enter", "escape", "tab", "backspace", "delete", "left",
"right", "up", "down", "home", "end". Put it on the app’s
outermost view to hear every key. Keys pressed with Cmd (or Ctrl on Windows)
go to .shortcut instead.
When the modifier keys matter (Shift+arrow to pan further, Delete without
Cmd), use .onKeyEvent. Its block gets a
KeyEvent: the key (without the modifiers:
"a" for Shift+A), the text it types, whether shift, alt, command
or control was held, and whether it’s repeated (a key held down):
app Pan(width: 320, height: 200) {    state x = 160.0    state y = 100.0
    Canvas { g in        g.fillCircle(x: x, y: y, radius: 10, color: .blue)    }    .onKeyEvent { e in        let step = if e.shift { 40.0 } else { 5.0 }        match e.key {            "left" -> { x -= step }            "right" -> { x += step }            "up" -> { y -= step }            "down" -> { y += step }            "space" -> {                x = 160                y = 100            }            _ -> {}        }    }}
.onKeyEvent also gets keys pressed with Cmd that no shortcut takes. When a
view has .onKeyEvent, keys go to it rather than to .onKey.
Saving a drawing as a picture
Section titled “Saving a drawing as a picture”renderImage runs a drawing block without
a window and saves the result as a PNG or JPEG file. It takes the same kind
of block as a Canvas, so one function can draw on screen and into a file:
fn drawBadge(_ g: Graphics) {    g.fillRect(x: 0, y: 0, width: g.width, height: g.height, color: .blue, radius: 16)    g.text("Tessel", x: g.width / 2, y: g.height / 2, size: 28, color: .white, weight: .bold, align: .center)}
fn main() {    let saved = renderImage(path: "badge.png", width: 200, height: 80, scale: 2) { g in drawBadge(g) }    print(saved)}
scale: 2 makes the picture 400 × 160 pixels: two for each point, as sharp
as a Retina screen shows it.
Making a PDF
Section titled “Making a PDF”writePDF runs a drawing block the same way
and saves what it draws as a PDF document, for printing or sending. Each
g.newPage() starts another page, so a document can have as many pages as
its content needs:
struct Item {    name: String    price: Float}
fn main() {    let items = [Item(name: "Survey, 3 days", price: 1200), Item(name: "Report", price: 450)]    let saved = writePDF(path: "invoice.pdf", title: "Invoice 42") { g in        g.text("Invoice 42", x: 50, y: 50, size: 24, weight: .bold)        var y = 100.0        for item in items {            // Room for one more line? If not, the next page.            if y > g.height - 50 {                g.newPage()                y = 50            }            g.text(item.name, x: 50, y: y)            g.text(item.price.formatted(decimals: 2), x: g.width - 50, y: y, align: .topTrailing)            y += 20        }        g.line(50, y + 4, g.width - 50, y + 4, color: .gray)    }    print(saved)}
Everything a Canvas can draw goes into a PDF: shapes and lines stay sharp
at any zoom, text stays text (it can be selected and searched, and its fonts
are in the file), and pictures keep their pixels. Pages are A4 (595 × 842
points; a point is 1/72 inch) unless width: and height: say otherwise;
US Letter is 612 × 792. g.textWidth tells how wide a text will be, for
lining up columns or wrapping long text yourself.
Testing
Section titled “Testing”In a headless run, tree and dump say what each canvas
drew: Canvas (6 fills, 1 stroke, 12 texts). The script commands press,
move, release, rightclick, doubleclick, wheel and pinch play the
mouse for views with .onPointer, and click, drag and hover work on
them too. key x sends a key to .onKey or .onKeyEvent, with modifiers
as in key shift+left.